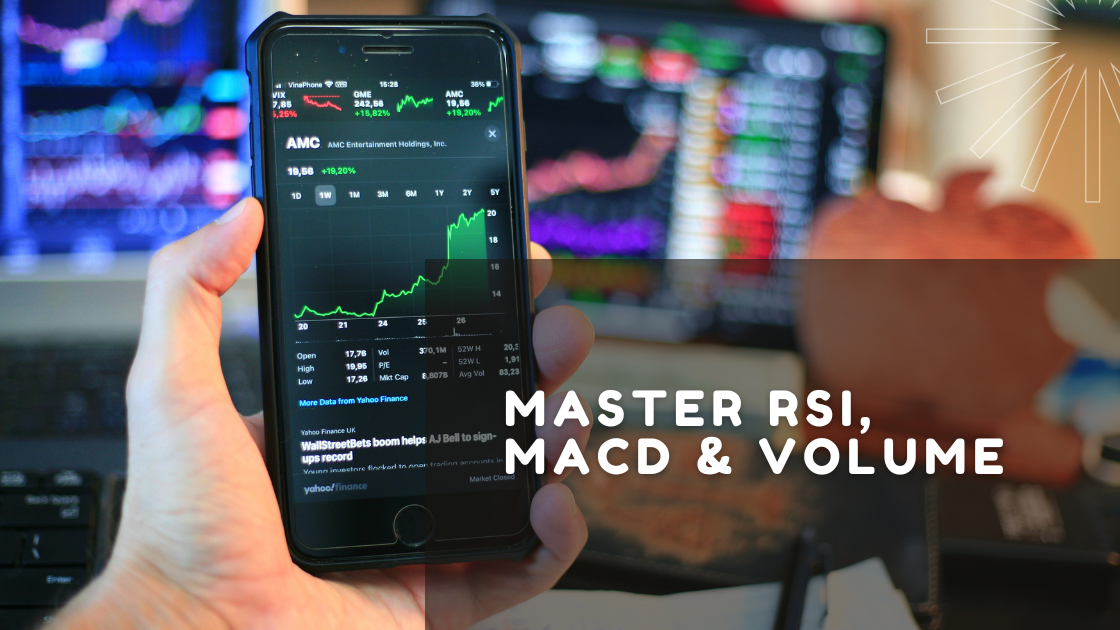
Why Reading Crypto Charts Matters in 2025
Read Crypto Charts In today’s fast-paced cryptocurrency markets, understanding how to read charts isn’t just an advantage — it’s a necessity. Whether you’re investing in Bitcoin, Ethereum, or emerging altcoins, knowing when to enter or exit a trade can mean the difference between profit and loss.
This 2025 how-to guide breaks down three essential indicators used by professional crypto traders:
-
RSI (Relative Strength Index)
-
MACD (Moving Average Convergence Divergence)
-
Volume
Let’s dive into how these tools work and how you can use them to make better trading decisions.
1️⃣ What is a Crypto Chart?
A crypto chart is a graphical representation of a coin’s price movement over time. It shows patterns that help traders analyze market behavior. Read Crypto Charts
Most commonly used charts include:
-
Candlestick Charts (popular for visual clarity)
-
Line Charts
-
Bar Charts
2️⃣ The Big 3: RSI, MACD, and Volume
📈 A. RSI (Relative Strength Index)
What It Does:
The RSI measures the strength and speed of a coin’s price movement to identify overbought or oversold conditions.
-
Scale: 0 to 100
-
Above 70 = Overbought (possible price drop)
-
Below 30 = Oversold (possible price rise)
How to Use RSI:
-
When RSI > 70 → consider taking profits or preparing to sell
-
When RSI < 30 → consider buying or entering long positions
-
Combine with trend lines to filter false signals
Pro Tip: RSI divergence (when price goes one way, and RSI goes another) is often a strong reversal signal.
📉 B. MACD (Moving Average Convergence Divergence)
What It Does:
MACD shows momentum and trend direction by comparing short-term and long-term moving averages.
-
MACD Line: 12-day EMA – 26-day EMA
-
Signal Line: 9-day EMA of the MACD
-
Histogram: Difference between MACD line and signal line
How to Read MACD:
-
MACD crosses above Signal Line → Buy Signal
-
MACD crosses below Signal Line → Sell Signal
-
Histogram expands = momentum is increasing
Best Use:
MACD is most effective in trending markets. Use with RSI to confirm trades. Read Crypto Charts
📊 C. Volume
What It Does:
Volume shows the number of coins traded during a specific period. It reflects market participation and strength.
Key Insights from Volume:
-
Rising price + rising volume = Strong trend
-
Rising price + falling volume = Weak trend
-
High volume spikes = Possible breakout or breakdown
Volume Confirmation Example:
A breakout from resistance is more reliable if supported by high volume.
3️⃣ Tools You’ll Need to Read Crypto Charts
To analyze charts professionally in 2025, use these tools:
| Tool Name | Use Case | Features |
|---|---|---|
| TradingView | All-in-one charting platform | RSI, MACD, volume, alerts, tools |
| CoinMarketCap | Price & volume insights | Charts for all listed tokens |
| Binance/Bybit | Live trading & analysis | Built-in indicators |
Most platforms allow custom indicators, alerts, and multiple timeframes (e.g., 1min, 1h, 1d, 1w). Read Crypto Charts
4️⃣ Step-by-Step Guide: Reading a Crypto Chart Like a Pro
✅ Step 1: Set the Right Timeframe
-
Day trading → 5m to 1h charts
-
Swing trading → 4h to daily charts
-
Long-term investing → Daily to weekly charts
✅ Step 2: Add RSI Indicator
-
Look for overbought (>70) or oversold (<30) signals
-
Watch for divergence patterns
✅ Step 3: Add MACD
-
Observe crossovers between MACD and Signal Line
-
Use histogram for momentum strength
✅ Step 4: Analyze Volume
-
Confirm breakouts with high volume
-
Watch for unusual volume spikes
✅ Step 5: Combine All Three
-
Best Entry Setup Example:
-
RSI near 30
-
MACD line just crossed above Signal Line
-
Volume increasing
= High-probability bullish reversal
-
5️⃣ Pro Tips for Beginners
-
Don’t rely on one indicator alone — Always combine 2-3 for better accuracy
-
Use stop-losses to protect against market reversals
-
Backtest your strategy using past data
-
Keep emotions out — Trust your analysis
🧠 Common Mistakes to Avoid
❌ Blindly entering trades based on RSI alone
❌ Ignoring volume when spotting breakouts
❌ Trading against the trend
❌ Overloading charts with too many indicators
❌ Chasing pumps or following Twitter hype without confirmation
🔮 Bonus: What’s New in 2025?
In 2025, chart analysis tools are more AI-powered and accessible. Platforms like:
-
Santiment
-
TokenMetrics
-
Glassnode
Read Crypto Charts now include on-chain data + technical indicators to give deeper insights. The combination of RSI, MACD, volume, and on-chain metrics is becoming the new standard for smart traders.
📘 Final Thoughts: Practice Makes Profits
Reading crypto charts is not rocket science — but it does require practice. The more charts you analyze, the more confident you’ll become.
Read Crypto Charts By mastering RSI, MACD, and volume, you’re already ahead of most beginner traders in 2025. Stick to your strategy, control emotions, and use data over hype.
4 min read


